


The Phosphorus Buffering Index – What Does it Mean for Your Soil?
With soil testing underway, in this article we take a closer look at the Phosphorus Buffering Index (PBI), and provide an overview of what it means for your soil and fertilizer use going into the new season.
What is PBI?
- PBI is a measurement of your soil’s tendency to chemically adsorb Phosphorus (P).
- The higher the PBI, the quicker and more strongly P binds to soil particles.
- Stronger soil binding means that there is less P available to plant roots.
Think of P adsorption a bit like magnetic binding. The strength of attraction depends on the nature of the materials and the strongest attractor wins (root or soil).
PBI is related to the number and type of “exchange” sites on your soil particles, which ultimately comes down to:
- Soil texture – Clay soils have smaller particles, which means a larger surface area, and more sites for P absorption. As a result, soils with a higher amount of clay typically have a higher PBI.
- Soil Composition – Higher levels of certain compounds in the soil, such as iron oxides and aluminium oxides mean that P binds to soil particles more strongly. This is due to the chemical nature and charges on these compounds.
Unfortunately, we cannot do much about these inherent soil characteristics. Lime can increase pH and gypsum can influence texture of some clays, but effects are temporary and the nature of high PBI soils is often to resist change, so we have to work with the soil limitations for P. The only farming management tool we have to improve P to crops in high PBI soils is higher P application rates.
PBI and the Colwell P Test
Like PBI, the Colwell P test is another important soil test that needs to be considered.
Colwell P is a measure of the phosphorus in the soil that is available for plants. The problem however, is that Colwell P values are somewhat independent of the soil’s ability to bind phosphorus, so a Colwell P test cannot be interpreted without an associated phosphorus buffering index (PBI).
On their own, both the Colwell P test and the PBI are only of limited value. Only when both Cowell P and PBI are looked at together can we get a good overall picture of the soil’s P status.
The important point to note is that soil Colwell P values needed for optimum crop production increase with increasing PBI values. This is because:
- Low PBI soils only bind small amounts of P, leaving more of the fertiliser-applied P available for plant uptake.
- High PBI soils bind higher amounts of P, making more of it unavailable for plant use. So, high PBI soils require greater applications of P to achieve plant-available P levels that support optimum yield potential.
What is Low and High PBI?
Low and high PBI can be somewhat subjective. There is a scale of categories, developed mainly in the Eastern States, that has generally been accepted nationally (Table 1 below) but WA soil experts and researchers added a number of categories at the low end, so we end up with categories like Low, Very Low and Very Very Low.
The reason for this break-up of the Low category is that WA soils are older and different in nature to Eastern State soils, and although we rarely see PBI in the High and Very High categories in WA we still find strong P binding happens at the upper end of the Low category.

Table 1: PBI Categories and published indicator Colwell P values required to support strong plant production.
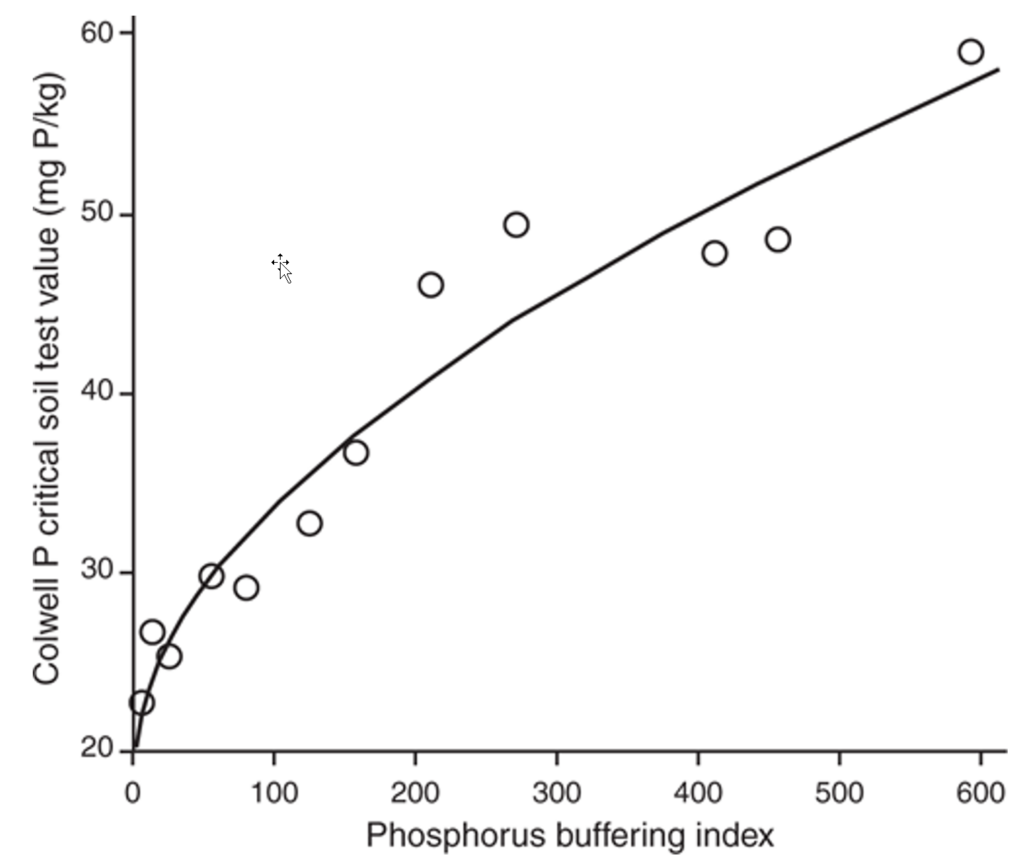
Figure 1: Soil Colwell P found to support 95% maximum pasture growth as PBI increases. P Moody (2007).
So, How Much P Should I Apply?
If your soil Colwell P is above those levels in Table 1 (right column) for the PBI category it falls in, work on replacement value based on what was exported in the last crop (for example, a PBI of 100 and a Colwell P of 38).
The amount of nutrient removed per tonne of production by different crops can be found here.
If your soil Colwell P is below those levels for the for the corresponding PBI category (for example a PBI of 100 and a Colwell P of 29), your crop will require replacement P, plus enough to balance the additional crop requirement and what the soil will bind after it is applied.
Here are a several P yield response curves from recent Summit Field Research trials for various crops in differing PBI soils around the state that may help a P rate decision. Note how the curves are shallower (keeps increasing with increasing P applied) at high PBI, whereas at lower PBI the yields flatten at much lower P rates.
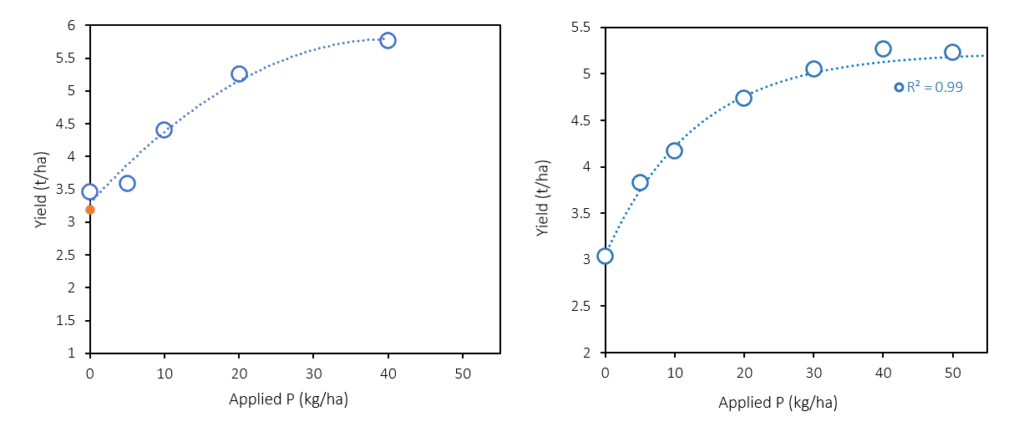
Figure 2 (left): Scepter Wheat, 2020, Boyup Brook. PBI (0-10 cm) = 416. Colwell P = 39.
Figure 3 (right): Spartacus Barley, 2019, Crossman. PBI = 175. Colwell P = 43.

Figure 4 (left): Scepter Wheat, 2018, Mingenew. PBI = 87. Colwell P = 11.
Figure 5 (right): Mace Wheat, 2019, North Stirlings. PBI = 37. Colwell P = 56.

Figure 6: Scepter Wheat, 2019, Merredin. PBI = 15. Colwell P = 19.
An important note is that the placement of P is critical. In general, 25 mm below the seed, or 20 mm below and just to the side of the seed has consistently shown to be the best strategy in WA soils.
inSITE Soil Testing
Get in touch with your local Area Manager to find out your soil’s PBI and Colwell P values through our inSITE soil analysis service.
Through Summit’s association with independent soil and plant analysis laboratory APAL, we are continuing to assess and develop promising new procedures to gauge plant-available soil P, such as the Diffusive Gradients in Thin films (DGT) test, and calibrate crop growth responses for Western Australian soils.


